
The Orangeville market stats for February 2019 are here.
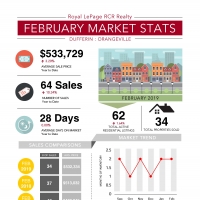
In February there were 34 sales in Orangeville which is down from 37 in February 2018. Year-to-Date there have been 64 sales in Orangeville an increase of 10.34% over the same period in 2018.
The average sales price Year-to-Date at the end of February was $533,729 which is up 3.20% compared to the same period last year. On average homes sold for 98.5% of their asking price.
We continue to see homes selling relatively fast in the Orangeville market with the average days on market at 28 days so far this year which is the exact same as the same period in 2018.
At the end of February there were 62 active listings which represents approximately a two months supply in the market.
If you are interested in discussing how these market stats may impact your specific situation just let me know and I’d love meet up with you.
| Month of February | 2019 | 2018 | % Change |
|---|---|---|---|
| Sales | 34 | 37 | -8.11% |
| Average Price | $532,334 | $513,032 | 3.76% |
| Days-on-Market | 27 | 20 | 35.00% |
| % of List Price | 98.3% | 98.5% | -0.20% |
| Year-to-Date | 2019 | 2018 | % Change |
|---|---|---|---|
| Sales | 64 | 58 | 10.34% |
| Average Price | $533,729 | $517,178 | 3.20% |
| Days-on-Market | 28 | 28 | 0.00% |
| % of List Price | 98.5% | 98.5% | 0.00% |
Post a comment