
Spring is here and the real estate market is showing signs of heating up. In the first three months of 2019 the transaction volume continues to be low, inventory remains tight and prices have continued to increase. There were some additional homes being listed for sale in March which is good news for the buyers who are looking to make a move.
Here’s a breakdown of the Market Statistics for March 2019.
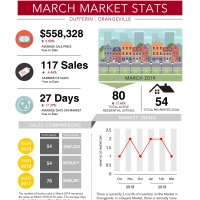
There were 54 transactions in March which is the same as March 2018. On a year-to-date basis there were 117 transactions which is a 4.5% increase form the first quarter of 2018 where there were 112 transactions.
We are starting to see prices climb again in the Orangeville market. The average sales price in the first quarter was $558,328, an 8.8% increase over the same period in 2018 and an increase of 3.1% over the year end 2018 figure.
Homes are selling for 98% of the asking price which indicates some stability in the pricing. The average days on market for a sold property continues to be relatively short at 27 days which is an increase of 17.4% form Q1 2018 but remains in line with the market conditions for most of the last 12 – 18 months.
At the end of March there were 80 active listings in Orangeville. This is an increase of 12.7% over the same period in 2018 but supply remains tight in the market. We continue to see approximately one month of inventory on the market which is an indication of a continued seller’s market.
Post a comment